Bitcoin’s price has been going through a significant drop after its failure to keep above the $100,000 region, but some signs of recovery are currently showing up.
Technical Analysis
By Edris Derakhshi
The Daily Chart
On the daily chart, Bitcoin recently found support around the $80,000 zone, aligning closely with the 200-day moving average. After a sharp correction from its $100,000+ peak, price action shows signs of recovery; it is currently trading near $85,000.
However, strong resistance lies around the $92,000 area, which previously acted as supply. The RSI is also climbing back towards neutral territory but hasn’t yet entered overbought levels, suggesting room for further upside if the bulls can maintain momentum. Daily closes above the 200 DMA, and the horizontal resistance near $92,000 can confirm a recovery and bullish continuation.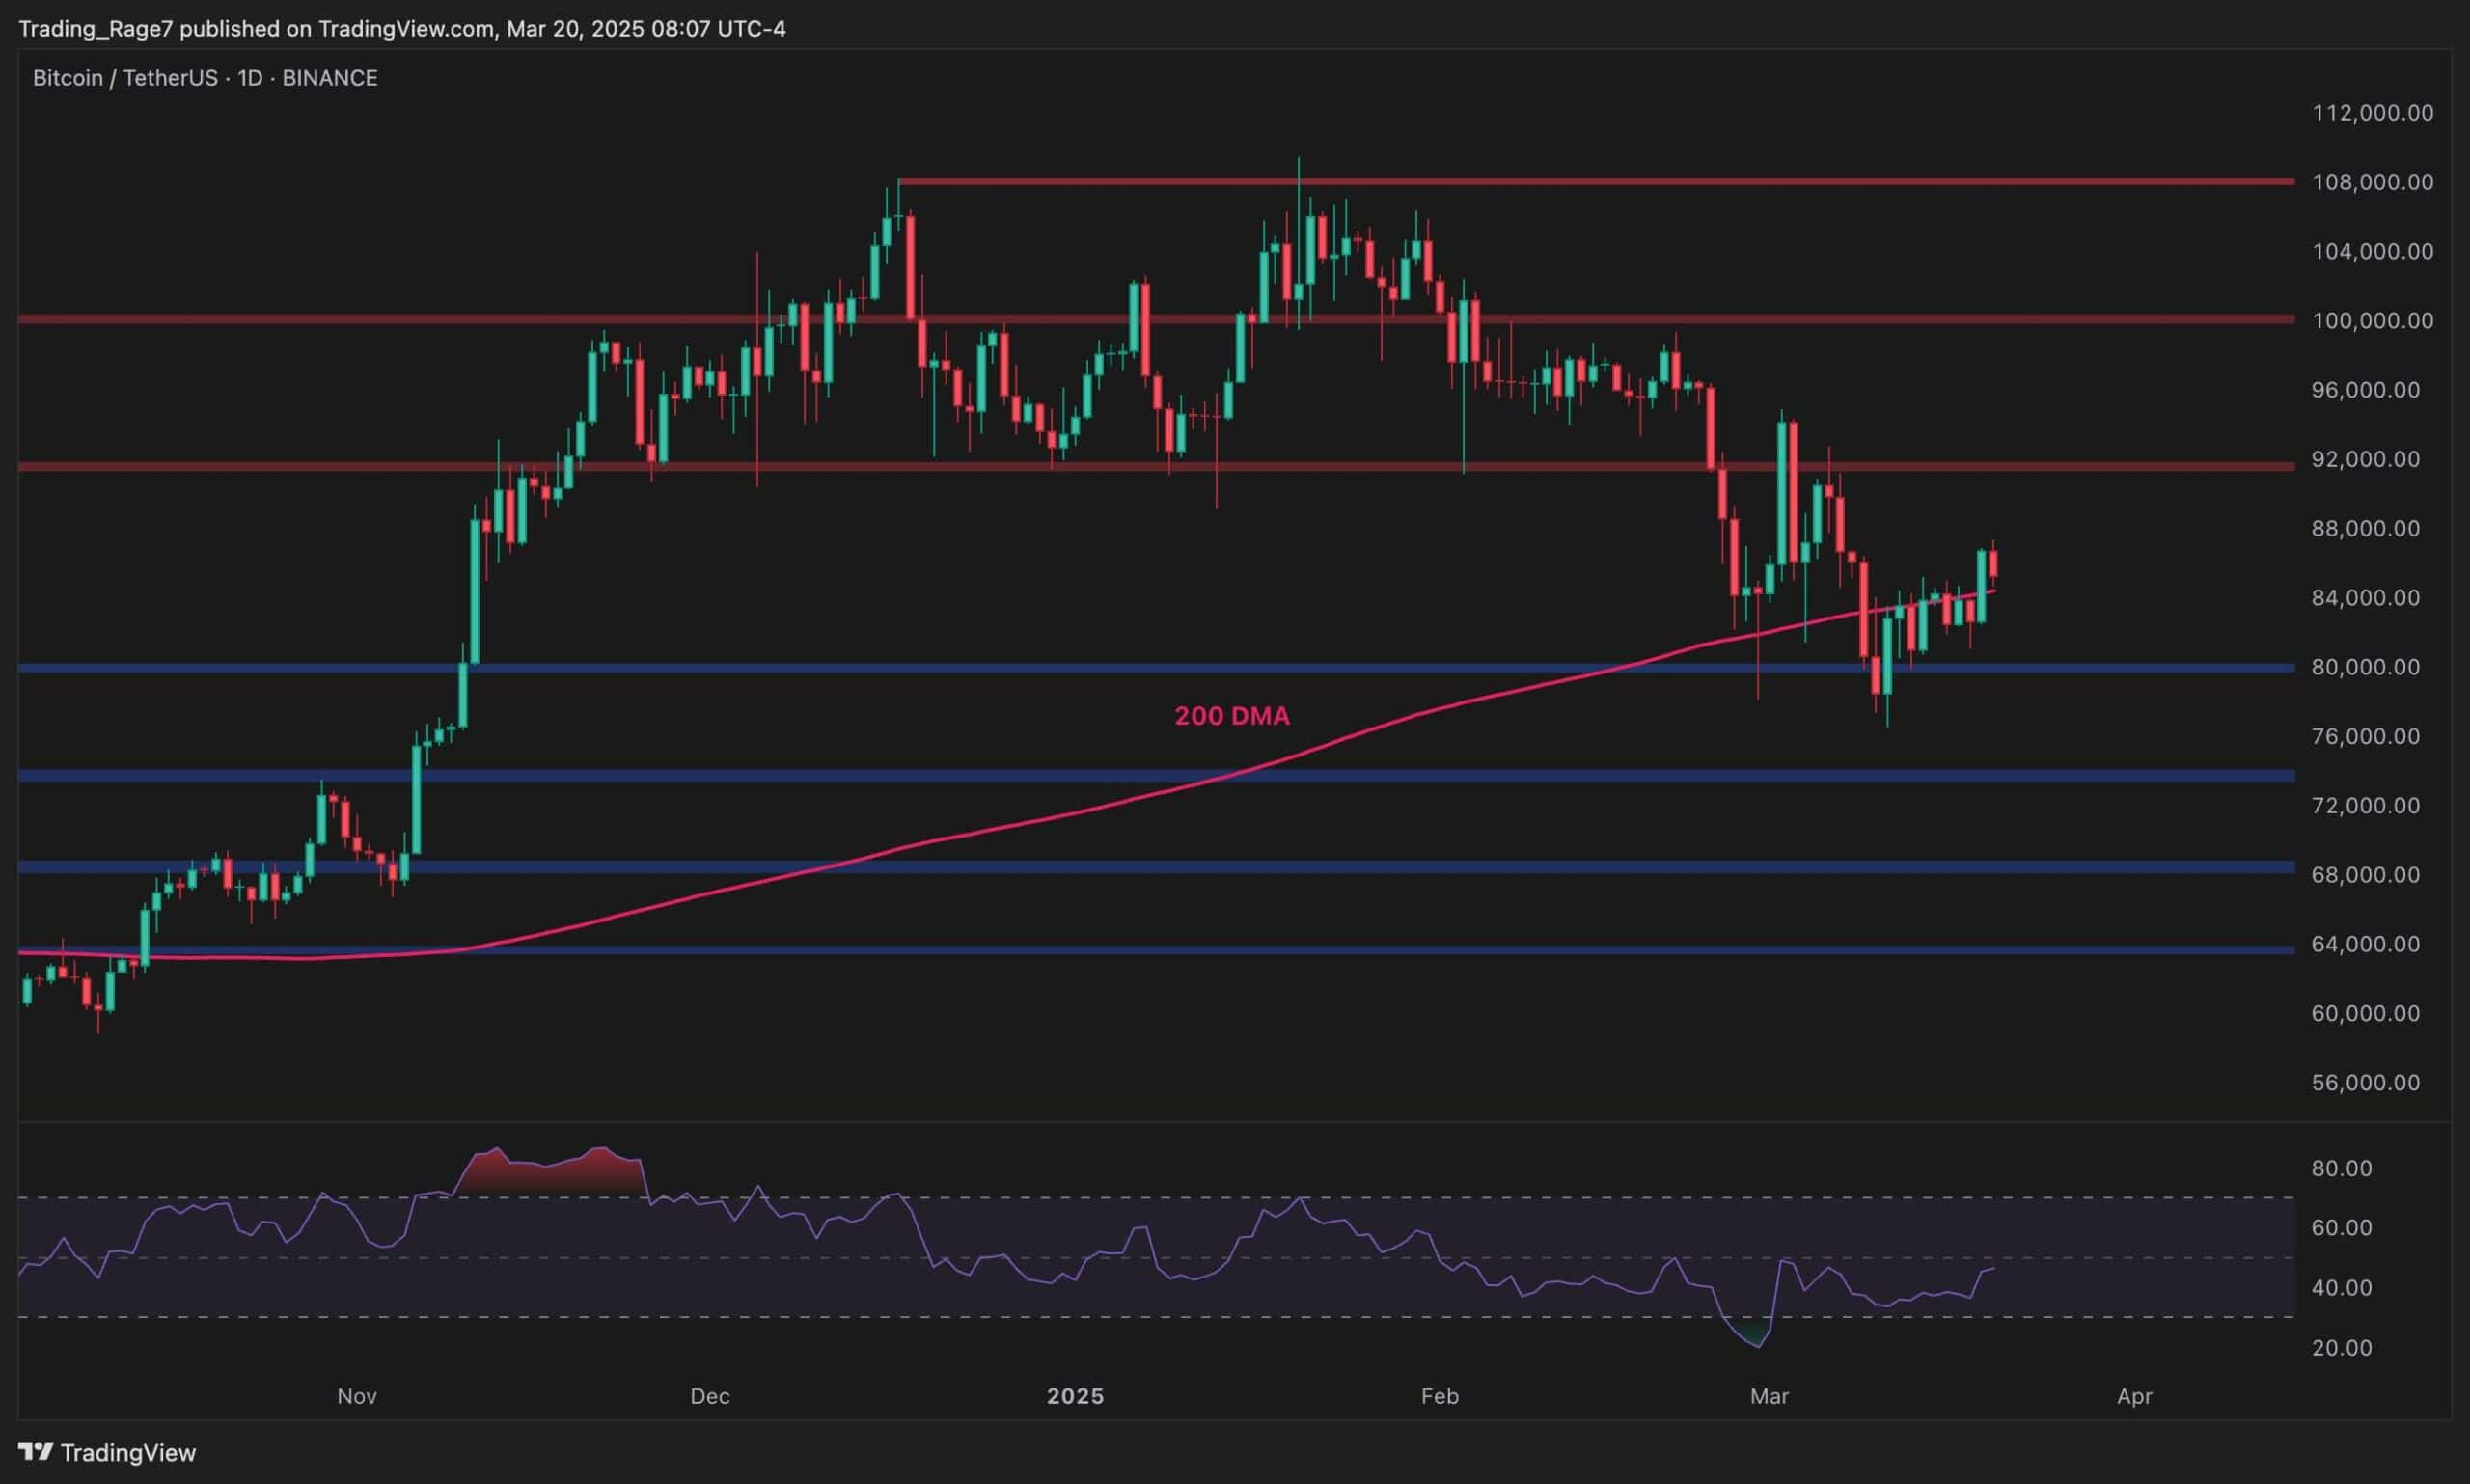
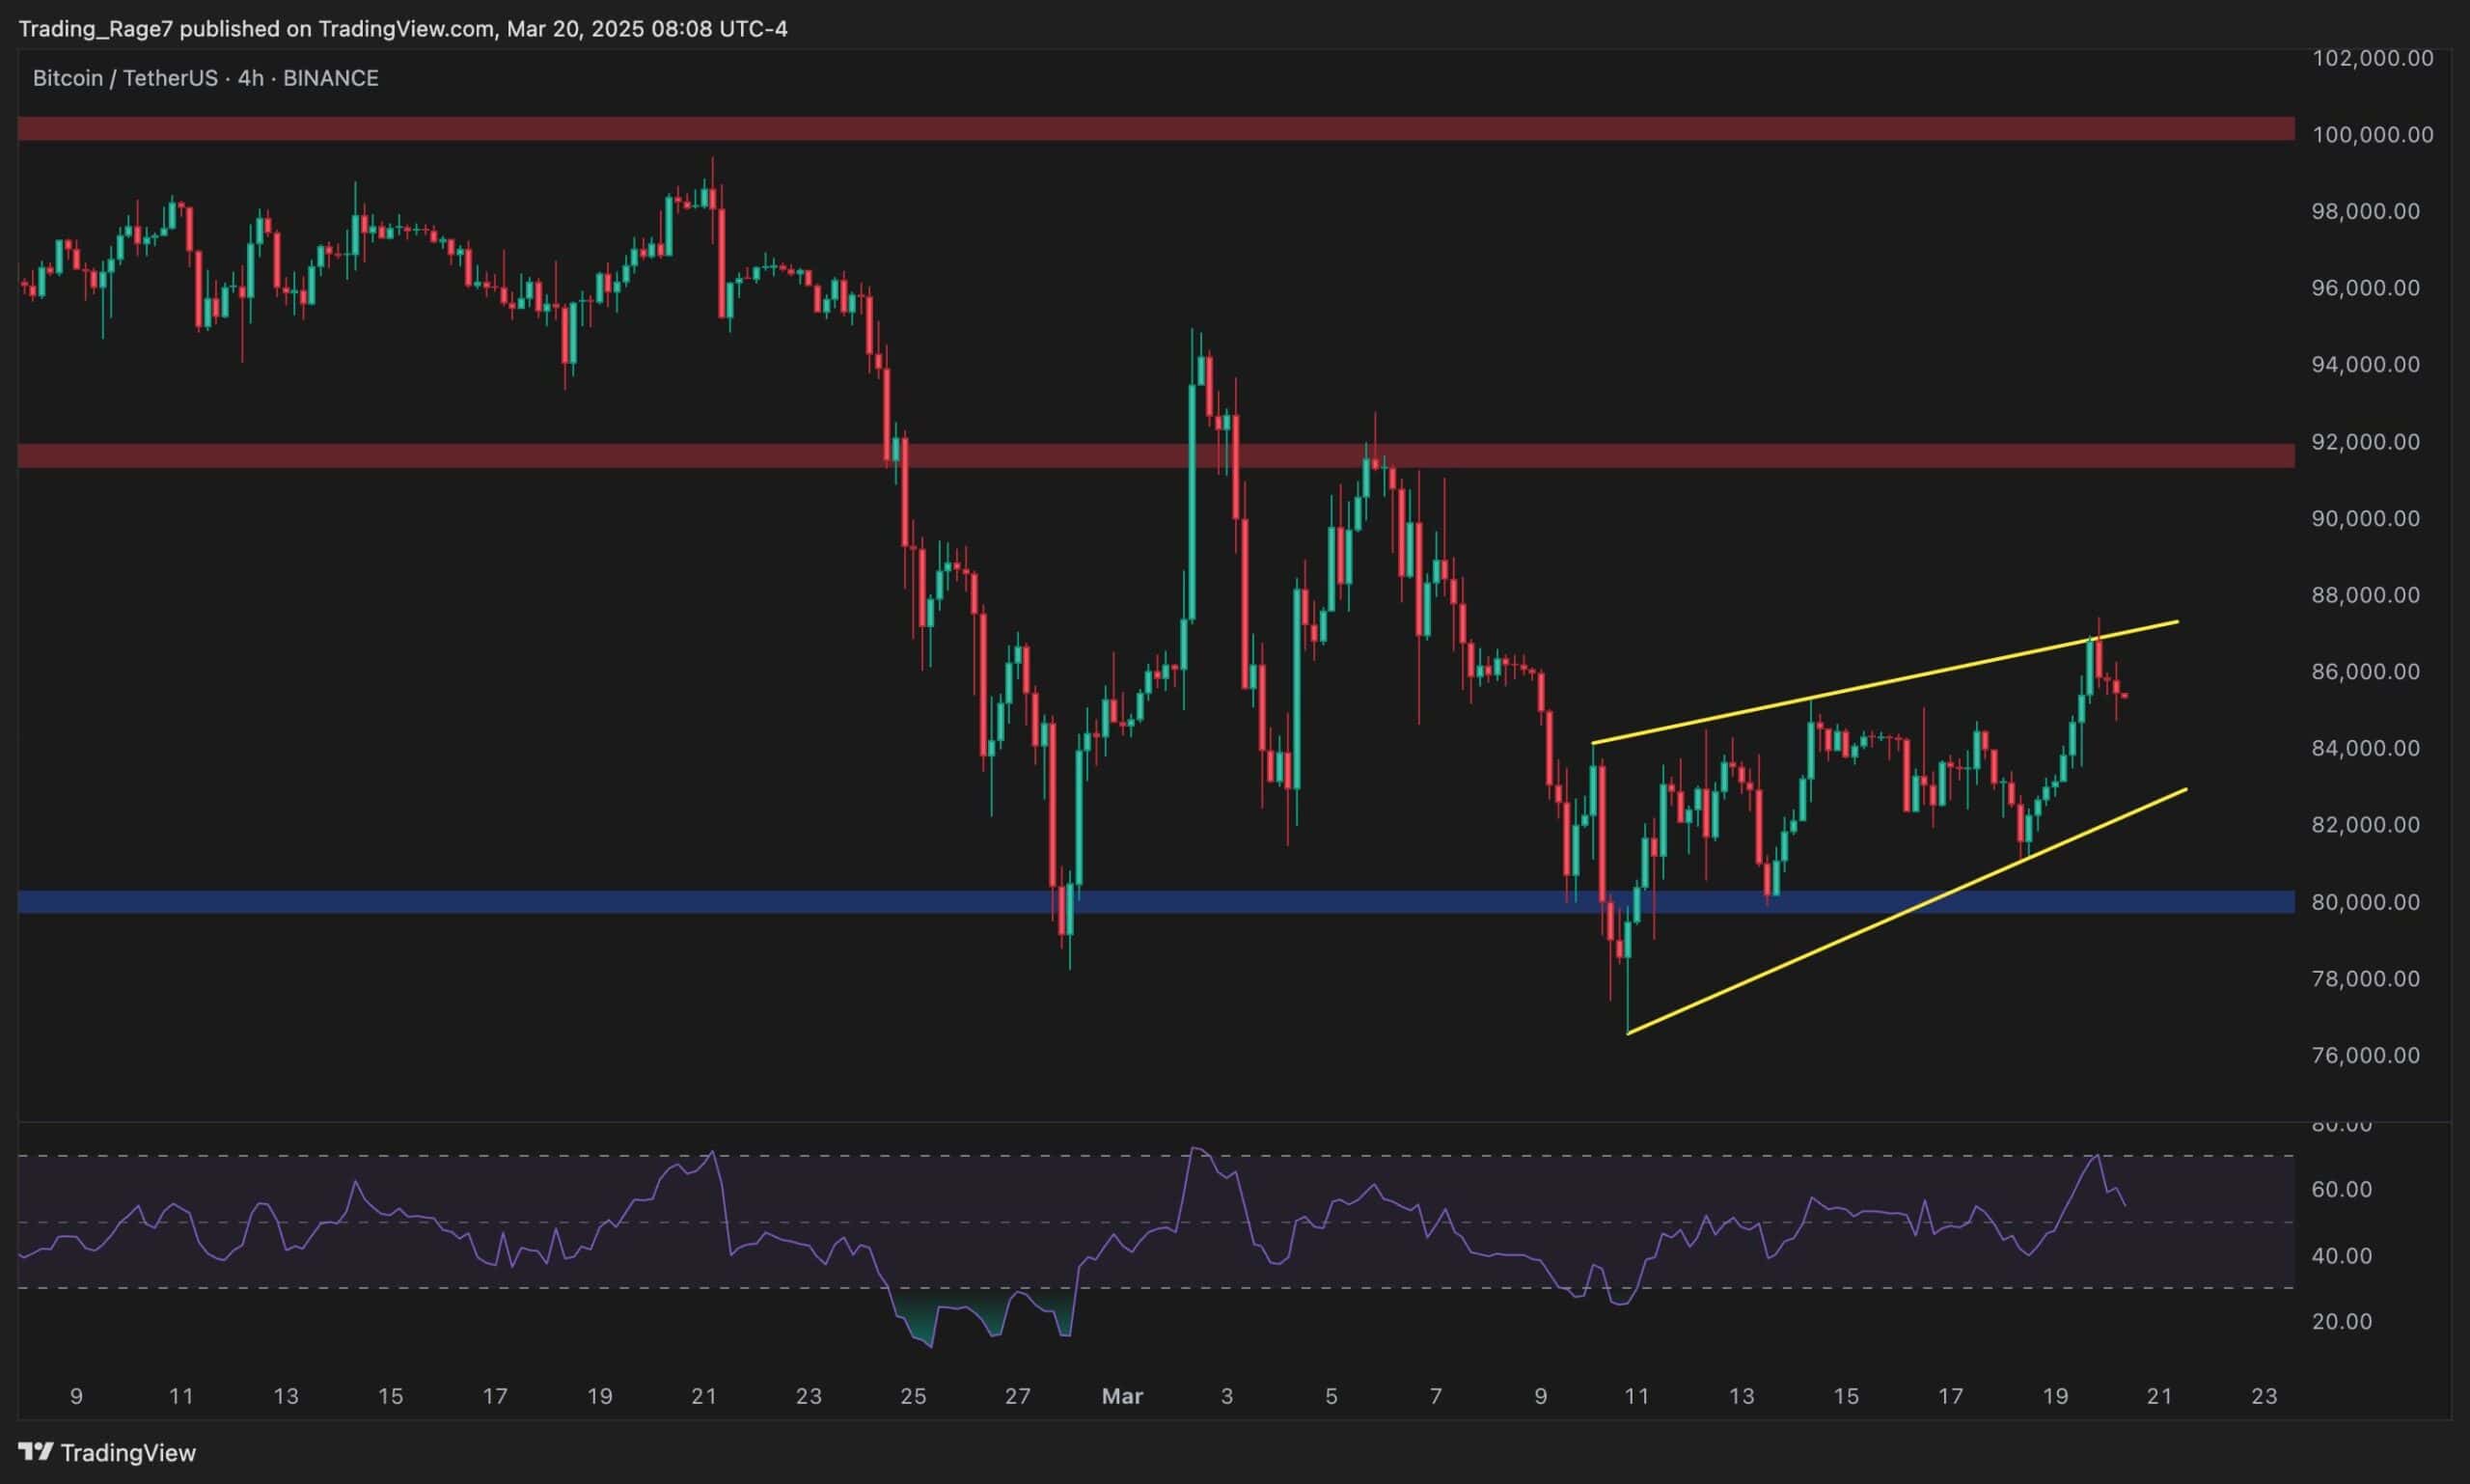
The 4-Hour Chart
The 4-hour chart reveals a clear rising wedge pattern, which BTC has been moving inside for a while now. With the rejection from the $87,000 region, a classic bearish reversal setup is forming, which often signals a pullback after a strong rally.
Immediate support sits near $82,000 – $80,000, matching the prior consolidation area. Moreover, the RSI on the 4H is decreasing rapidly, indicating a weakening bullish push. Unless the wedge is broken to the upside quickly, there’s potential for a deeper retracement towards the blue support zone around $80,000 in the short term.
On-Chain Analysis
By Edris Derakhshi
Bitcoin Active Addresses
The recent downtrend in Bitcoin’s active addresses paints a concerning picture. After peaking in February 2024, the number of active addresses has been consistently declining, even as BTC’s price reached new highs. This divergence signals weakening network participation and user engagement.
The sharp drop in active addresses over the past months suggests that fewer unique participants are transacting on-chain, which often reflects reduced organic demand and market interest. If this downtrend continues, it could aggravate bearish sentiment, as lower network activity typically precedes or confirms price corrections.
In the current context, the declining active addresses metric may act as a warning sign that the recent bullish bounce lacks fundamental on-chain support, potentially increasing the risk of a deeper crash.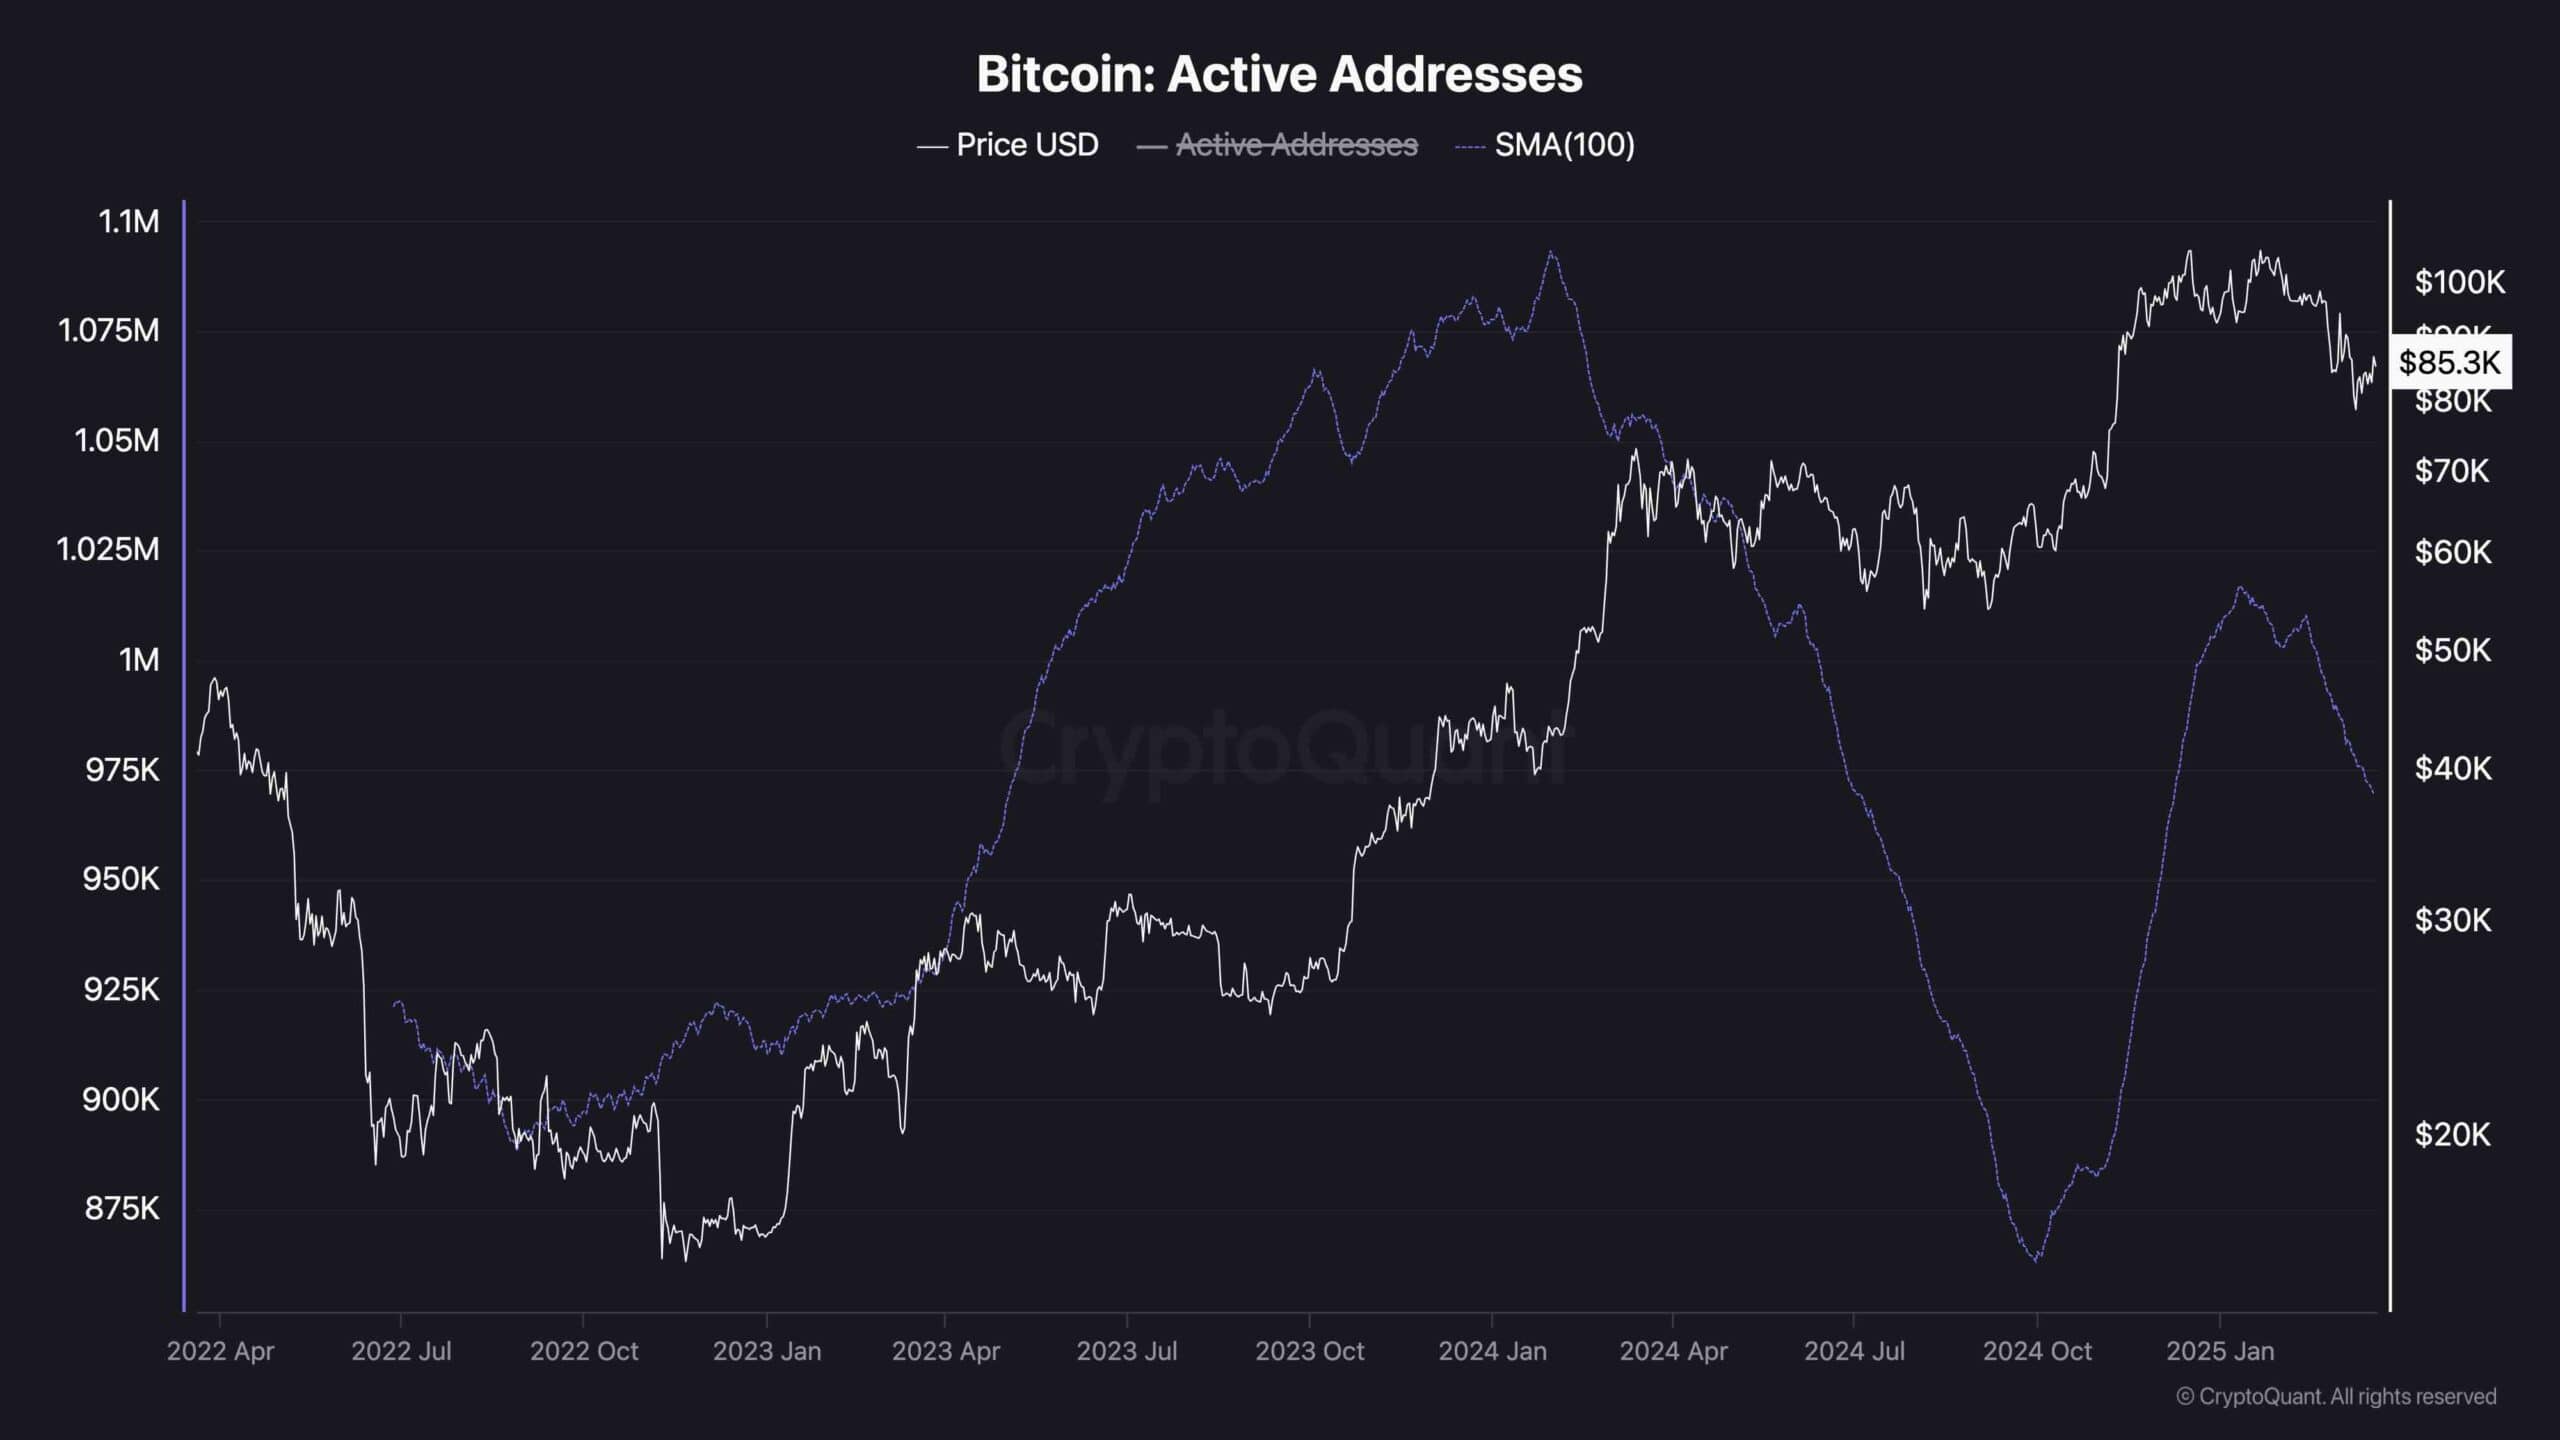
The post Bitcoin Price Analysis: Is BTC on Track for $92K? appeared first on CryptoPotato.


Leave a Comment